Logistics & Supply Chain
Corporate Drinkware Inventory Forecasting and Demand Planning Guide
Build a corporate drinkware inventory forecast using replacement demand, hiring plans, events, promotions, supplier constraints, stockout data, and demand planning scenarios.
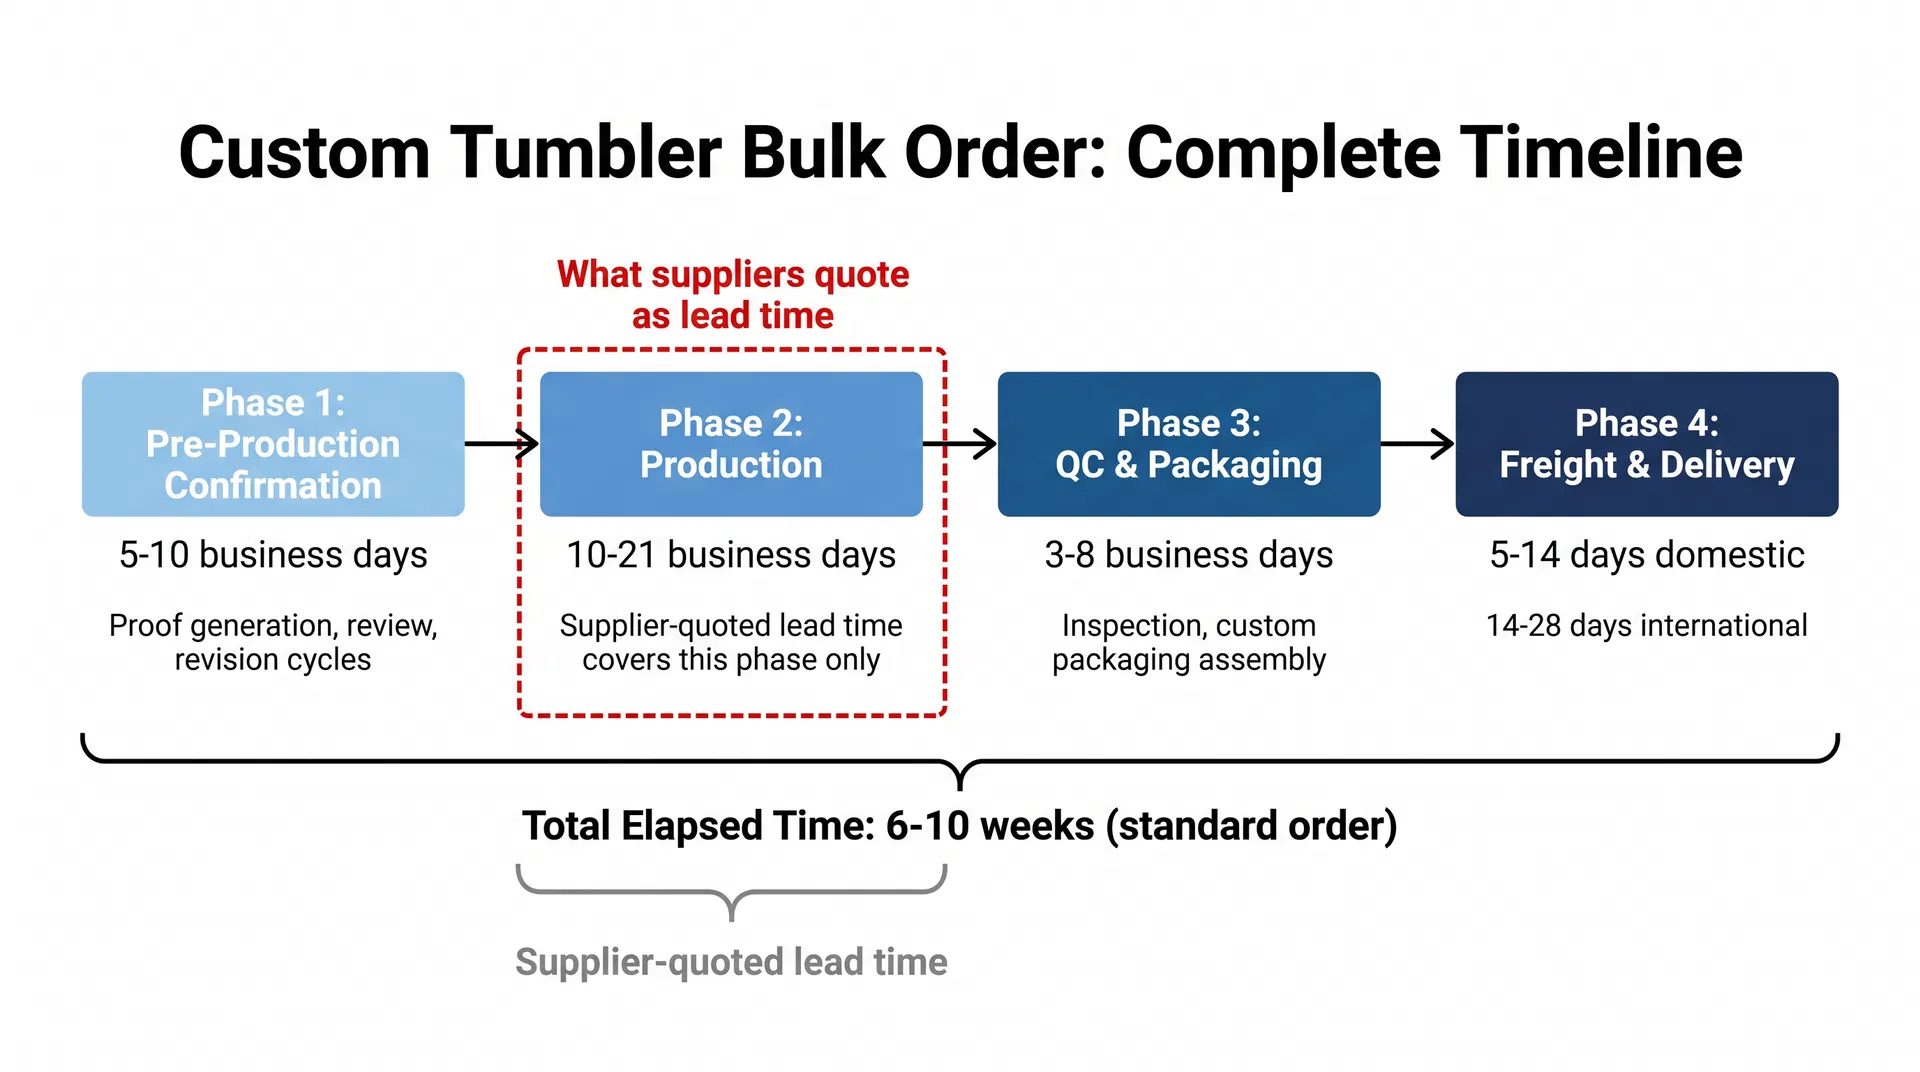
Corporate drinkware inventory forecasting is the process of estimating how many branded bottles, tumblers, mugs, accessories, or complete gift kits a company will need during a defined future period. Demand planning turns that estimate into purchasing, production, allocation, replenishment, and fulfillment decisions. For B2B drinkware, a useful forecast must combine historical usage with hiring plans, events, client campaigns, product versions, supplier lead times, and the reality of incomplete or unavailable inventory.
Quick answer: Build a corporate drinkware demand forecast by separating routine replacements, employee onboarding, client gifting, events, and promotional campaigns; clean the inventory and usage history; mark stockouts and one-time promotions; then review the forecast with procurement, HR, marketing, sales, logistics, and the supplier. Use the forecast to set reorder points, safety stock, production timing, and allocation rules—not as a promise that demand will be exactly correct.
A forecast is a decision system, not just a spreadsheet average. If a company shipped 1,000 tumblers last year, that number alone does not explain whether 600 went to a one-time conference, 250 supported new hires, and 150 replaced damaged units. A useful plan distinguishes those causes because they have different probabilities of repeating.
The corporate drinkware reorder point and safety stock guide explains the inventory trigger that follows from a demand plan. This article focuses on how to build the demand signal before setting that trigger.
What is the difference between demand forecasting and demand planning?
Demand forecasting estimates future consumption. Demand planning uses that estimate, together with commercial and operational knowledge, to decide what the company should buy, produce, hold, allocate, and release. Forecasting answers “how much might be needed?” Planning answers “what should we do about it, by when, and with which constraints?”
For branded drinkware, the forecast may be 1,200 complete kits for the next quarter. The demand plan must determine whether those kits are one standard version, three regional versions, or two product configurations; whether 400 are needed before a conference; whether the supplier can meet the decoration and packaging schedule; and whether the company should buy all units or stage the purchase.
| Concept | Primary question | Example |
|---|---|---|
| Demand forecast | How many units may be needed? | 1,200 kits next quarter |
| Demand plan | What actions support that need? | Order 800 now and 400 after event confirmation |
| Supply plan | Can approved suppliers deliver the right version? | Production, QC, freight, and receiving timeline |
| Inventory plan | Where should units be held? | 600 warehouse kits, 400 event kits, 200 safety stock |
| Allocation plan | Who receives the units and when? | New hires, clients, regional offices |
| Replenishment plan | When should the next order trigger? | Reorder at 796 complete kits |
The University of Tennessee’s Global Supply Chain Institute describes demand forecasting as a method for predicting future product demand and emphasizes that forecasts depend on data quality, methods, and experienced judgment.1 That combination is especially important for corporate gifting, where a CRM opportunity, an HR hiring plan, or an event registration list can be as important as historical shipments.
What demand categories should a corporate drinkware forecast include?
Separate the forecast into demand categories before calculating a total. Routine replacement demand is usually more stable than a client campaign. New-hire demand may follow an HR plan. Event demand may be fixed by an attendance estimate and date. Promotional demand may depend on a marketing calendar. Each category should have a quantity, timing, confidence level, and owner.
A blended number hides the reason behind the demand and makes revision difficult. If a conference is cancelled, the event demand should be removed without automatically erasing the replacement program. If hiring accelerates, onboarding demand should be updated without assuming the same increase in client gifts.
| Demand category | Typical signal | Forecast treatment |
|---|---|---|
| Employee replacements | Historical replacement rate | Rolling average with quality and loss review |
| New-hire kits | Approved hiring plan | Monthly cohort forecast with confidence level |
| Client gifts | Account, occasion, and campaign plan | Named or grouped opportunity forecast |
| Trade shows and events | Date, attendance, and distribution rule | Dated event quantity with contingency |
| Promotions | Marketing calendar and channel plan | Scenario forecast with lift assumptions |
| Internal programs | Wellness, recognition, or anniversary schedule | Program calendar and allocation rules |
| Product launch | Launch plan and audience size | Ramp scenario rather than historical average |
A category owner should be able to explain the forecast. Procurement may own supplier capacity and MOQ. HR may own hiring demand. Marketing may own campaign quantities. Sales may own client-gift opportunities. Logistics may own inventory availability and distribution constraints.
What data is needed for inventory forecasting?
Start with clean usage, inventory, and event data. The data should use consistent product, kit, location, and date definitions. If one system counts a tumbler body and another counts a complete kit, the forecast will combine different units. If a product’s SKU changes after a lid revision, historical records need a mapping that shows whether the versions are interchangeable.
At minimum, collect the following fields:
| Data group | Useful fields |
|---|---|
| Product master | SKU, capacity, color, lid, decoration, packaging, version |
| Usage history | Date, quantity issued, recipient group, destination, reason |
| Inventory | On hand, allocated, picked, packed, quarantined, obsolete |
| Supply | Supplier, MOQ, order date, lead time, open order, expected receipt |
| Campaigns | Event, date, audience, quantity, confidence, owner |
| Workforce | Hiring starts, location, role group, onboarding cadence |
| Commercial | Client opportunities, probability, expected ship date |
| Quality | Rejections, replacements, rework, component shortages |
| Logistics | Destination, shipment method, delivery window, exceptions |
The data should be time-stamped and reconciled. A current inventory snapshot is useful, but it cannot replace the history of what was actually usable, allocated, delayed, or rejected. The corporate gift fulfillment cost per recipient guide explains why planned, shipped, delivered, and usable units should remain separate.
Crisp’s retail demand forecasting guidance highlights the need to align point-of-sale or sales data with inventory data and event or promotion context.2 The same principle applies to corporate drinkware: a period with zero shipments may mean no demand, a stockout, an approval delay, or a cancelled event. Those causes should not be treated as the same observation.
How should sales be separated from true demand?
Sales or shipment history records what was fulfilled. True demand also includes what people or teams requested but could not receive because the product was out of stock, late, unavailable in the right configuration, or blocked by an approval decision. If a company requested 300 blue tumblers and received only 180 because 120 were unavailable, using 180 as demand may understate the next requirement.
Add a reason code when demand is not fulfilled. Useful codes include stockout, supplier delay, quality hold, budget cancellation, event cancellation, data error, substitute accepted, and request deferred. A forecast can then distinguish a genuine demand decline from an availability problem.
| Observation | What the raw number says | What the planner should ask |
|---|---|---|
| Zero shipments | No units moved | Was there no demand or no usable inventory? |
| Partial shipment | Some demand was fulfilled | Was the balance backordered or cancelled? |
| Emergency order | An unusual purchase occurred | Was it caused by a forecast error or a one-time event? |
| High returns | Demand appears high | Were kits defective, duplicated, or misaddressed? |
| Substitute product | Original SKU demand looks low | Did the substitute hide demand for the preferred SKU? |
| Late event shipment | Consumption appears delayed | Should demand be shifted to the event date? |
This adjustment is important for branded products because replacement and rework demand may be created by the supply process itself. A logo defect can reduce available stock and create replacement demand even when the employee or client need has not changed.
Which forecasting method fits branded drinkware?
Use a method that matches the demand pattern and data quality. A simple moving average can work for stable replacement demand. A weighted average gives more importance to recent observations. A seasonal profile can capture recurring annual events. A causal or driver-based forecast uses hiring, event attendance, account plans, or marketing activity. A scenario forecast is useful when demand is uncertain or the product is new.
Do not force every SKU into the same model. A high-velocity standard tumbler used for daily onboarding behaves differently from a low-velocity VIP gift with intermittent orders. A slow-moving item may show many zero-demand periods followed by a large event spike. The average can be mathematically correct but operationally misleading.
| Method | Best fit | Main caution |
|---|---|---|
| Moving average | Stable replacements and recurring usage | Lags when demand changes |
| Weighted moving average | Recent usage matters more | Weights must be explained |
| Seasonal profile | Annual holidays, conferences, or hiring cycles | Needs comparable history |
| Driver-based forecast | Hiring, events, client campaigns | Inputs can change or be uncertain |
| Scenario forecast | New products, volatile programs, uncertain events | Requires explicit assumptions |
| Collaborative forecast | Cross-functional B2B programs | Meeting quality affects data quality |
The University of Tennessee guide lists historical, trend, regression, econometric, sales-force, market research, and expert methods as possible forecasting approaches.1 A corporate merchandise team rarely needs the most complex model first. It needs a transparent model that combines clean history with the people who know upcoming events and constraints.
How should historical usage be prepared?
Normalize historical usage before calculating an average. Remove duplicate transactions, correct unit conversions, map old SKUs to current versions where appropriate, and separate samples from recipient-ready kits. Mark campaign periods, product launches, supplier shortages, and quality holds.
Use a consistent time bucket. Monthly planning is often easier for corporate programs because hiring, events, budgets, and supplier orders are usually managed by month. Daily data can still be useful for shipment execution and event readiness. A monthly forecast should not be built by averaging a mixture of daily, weekly, and quarterly numbers without a clear conversion.
Review outliers instead of deleting them automatically. A large annual conference may be a recurring event, a one-time event, or a signal that the business is expanding. The right treatment depends on the business plan. Keep the original observation, document the adjustment, and show the forecast both with and without the event when the decision is material.
| Data preparation step | Control |
|---|---|
| Standardize units | Define body, component, kit, carton, and complete package |
| Map product versions | Record whether old and new versions are interchangeable |
| Remove duplicates | Reconcile order, shipment, and fulfillment records |
| Mark stockouts | Do not treat unavailable periods as ordinary low demand |
| Mark promotions and events | Identify demand that may not repeat at the same level |
| Separate returns and replacements | Avoid double-counting original and replacement demand |
| Record cancellations | Distinguish cancelled demand from fulfilled demand |
| Retain adjustments | Keep an audit trail for every material change |
A forecast with fewer but cleaner observations is often more useful than a large file with inconsistent definitions. The owner should be able to trace a forecast input back to an inventory report, campaign plan, order, or approved business assumption.
How should seasonality and events be forecast?
Seasonality is a repeating pattern connected to time. An event is a dated business activity that may or may not repeat. Treat the two differently. A recurring annual holiday program can use a seasonal profile. A one-time conference should be a separate event driver with a confidence level and arrival deadline.
Build an event calendar with the date, audience, location, distribution method, product version, planned quantity, decision owner, and last confirmation date. A demand number without a date cannot be translated into production or delivery action.
Events should also include a release pattern. A company may distribute 1,000 bottles at a single conference, send 200 to VIP speakers in advance, and hold 100 for late registrations. Those are three operational requirements even if the total demand is 1,300 units.
| Event field | Example |
|---|---|
| Event name | Annual customer summit |
| Required arrival | September 12 |
| Distribution date | September 16 |
| Audience | 1,000 attendees and 100 speakers |
| Product version | 24-ounce black tumbler, logo v4 |
| Distribution | Bulk carton to venue plus direct-ship VIP kits |
| Contingency | 5% for damaged or late-registered recipients |
| Confirmation owner | Events manager |
| Supplier release date | Approved after sample and artwork sign-off |
A forecast review should ask whether the event is approved, probable, or exploratory. Use different planning scenarios rather than treating a tentative event as firm demand. The supplier should receive the expected range and the date by which the quantity will be confirmed.
How should new-hire and employee program demand be forecast?
Employee demand should be linked to the hiring or onboarding plan, not only to last year’s shipment history. Collect expected start dates by month, location, business unit, and kit version. Add replacement demand for losses, breakage, transfers, or delayed onboarding. If a kit is issued only after a probation period, use the actual issuance rule rather than the hire date.
A simple employee forecast is monthly expected starts multiplied by the kit issue rate, plus replacement demand, plus approved buffer. The issue rate may be less than 100% if some employees receive a different program or decline the kit. The forecast should explain the assumption.
| Employee input | Why it affects the forecast |
|---|---|
| Planned starts | Creates new kit requirements |
| Start-date timing | Determines when complete kits must be available |
| Location | Changes bulk versus individual fulfillment |
| Role or level | May determine kit version or gift value |
| Replacement rate | Captures ongoing unit loss and damage |
| Program eligibility | Prevents overforecasting non-eligible employees |
| Onboarding cadence | Converts hires into monthly shipment waves |
When hiring information is uncertain, use a low, expected, and high scenario. Procurement can then decide whether to buy all expected units, stage production, or hold flexible components. A complete custom kit with printed inserts may be less flexible than a standard drinkware unit with a later-added card.
How should client and sales demand be forecast?
Client-gift forecasts should use opportunity stages rather than treating every account idea as committed demand. Record account, occasion, expected recipients, product version, target delivery, probability, and approval owner. A weighted forecast can multiply quantity by an agreed probability, but the unweighted opportunity list should remain visible for capacity planning.
Sales and marketing should also identify strategic clients or events where the cost of a stockout is unusually high. A VIP gift may require a different safety stock rule than a routine giveaway. The forecast should not hide that service-level choice inside an unexplained percentage.
| Opportunity field | Planning use |
|---|---|
| Account or program | Connects demand to a business owner |
| Occasion | Identifies timing and repeatability |
| Recipient count | Provides the base quantity |
| Probability | Supports weighted and scenario forecasts |
| Product and logo version | Protects specification accuracy |
| Target delivery | Determines production and freight deadline |
| Approval status | Separates idea, likely, and committed demand |
| Replacement rule | Sets the post-delivery buffer |
The custom drinkware RFQ template can help keep product, decoration, packaging, MOQ, and lead-time inputs consistent when an opportunity becomes a sourcing request.
How should forecast accuracy be measured?
Measure forecast performance against the decision the forecast was intended to support. A forecast may be close in total units but badly timed for an event. It may be accurate for a standard SKU but consistently miss VIP kits. It may be numerically accurate because a stockout suppressed actual shipments. Use several indicators rather than one accuracy score.
Useful measures include forecast error, forecast bias, absolute error, stockout rate, excess inventory, emergency order count, event service level, and obsolete branded inventory. Always state the period, unit, product version, and denominator.
| Metric | What it reveals |
|---|---|
| Forecast error | Difference between forecast and adjusted demand |
| Forecast bias | Consistent overforecasting or underforecasting |
| Absolute error | Size of misses without offsetting signs |
| Stockout rate | Whether demand could be served |
| Excess inventory | Whether the plan created unnecessary holding |
| Emergency orders | Whether the forecast or lead time was inadequate |
| Event service level | Whether required units arrived on time |
| Obsolescence | Cost of old logos, packaging, or versions |
Crisp recommends measuring outcomes such as availability, stockouts, inventory on hand, inventory health, and forecast bias instead of relying only on a single accuracy number.2 For corporate drinkware, an additional useful measure is complete-kit availability: whether the body, lid, accessory, packaging, and insert were all available when required.
Worked inventory forecast example
Assume a company plans the next quarter for a standard employee tumbler program. Historical adjusted demand shows 240 replacement kits per month. HR expects 180 new hires in month one, 220 in month two, and 260 in month three. The kit issue rate is 90%. Marketing has approved a 300-unit customer event in month two. A separate 100-unit VIP shipment is probable at 70% confidence. The team uses a 5% event contingency for the approved event and keeps 180 kits as safety stock.
| Demand source | Calculation | Forecast quantity |
|---|---|---|
| Routine replacements | 240 × 3 months | 720 |
| New hires | (180 + 220 + 260) × 90% | 594 |
| Approved customer event | 300 × 105% | 315 |
| Probable VIP shipment | 100 × 70% | 70 weighted; 100 scenario |
| Safety stock | Program policy | 180 |
| Expected planning quantity | 720 + 594 + 315 + 70 + 180 | 1,879 |
| High scenario quantity | Replace 70 weighted with 100 | 1,909 |
The expected planning quantity is 1,879 kits, while the high scenario is 1,909 kits. The 30-kit difference is small compared with the total program, but it should still be visible because the VIP shipment may have a fixed delivery date. Procurement can decide whether to buy 1,879, reserve capacity for 1,909, or stage the uncertain 30 units.
This is a planning example, not a supplier quotation. The team should subtract usable starting inventory, add confirmed inbound inventory, check the product version, and test whether the production and fulfillment timeline meets each dated requirement. If the approved event happens before the next normal replenishment, event inventory must be prioritized and scheduled separately.
How should the forecast connect to reorder points and safety stock?
The forecast supplies expected demand by time period. The reorder point uses demand during replenishment lead time plus a safety stock buffer. Do not set a reorder point from an annual forecast divided by 365 when demand is dominated by monthly hiring waves and dated events. Convert the forecast into the time unit that matches the lead time and review cycle.
For example, if expected daily usage is 18 complete kits and usable replenishment lead time is 32 days, lead-time demand is 576 kits. With 220 kits of safety stock, the reorder point is 796 kits. If an approved event adds 300 kits during that same period, the planning system should either add the event to the time-phased demand or create a separate event purchase requirement.
The reorder point and safety stock guide includes the full formula and a usable-inventory example. The forecast and ROP should use the same definitions of complete kit, available inventory, lead time, and demand category.
How should inventory forecasting account for supplier constraints?
A demand forecast does not guarantee supply. Review MOQ, carton multiples, production capacity, decoration setup, packaging minimums, approval deadlines, quality release, freight, and receiving. A forecast that calls for 150 units may still require a 500-unit MOQ. A forecast that calls for 1,000 units by a fixed date may exceed a supplier’s capacity even if the annual quantity is reasonable.
Create a supply feasibility check beside the forecast. It should show the required quantity, required date, approved supplier, MOQ, available capacity, expected lead time, quality and packaging requirements, and fallback option. If supply cannot meet the plan, the decision should be escalated before the stockout or missed event.
| Supply constraint | Forecasting question |
|---|---|
| MOQ | What happens to excess units after the forecast period? |
| Capacity | Can the supplier make the peak quantity by the required date? |
| Decoration setup | Can artwork and color approvals be completed on time? |
| Component availability | Are lids, gaskets, straws, and packaging available together? |
| Quality release | Is inspection time included before inventory is usable? |
| Freight | Does the transport plan meet the arrival date? |
| Product revision | Will forecast units remain usable if the version changes? |
The custom drinkware supplier evaluation checklist can be used to compare capacity, quality controls, communication, and replenishment readiness.
How should a forecast review meeting work?
Use a repeatable monthly or quarterly cadence with a short exception list. The meeting should not rebuild every number from scratch. It should review changes, assumptions, risks, and decisions. Each function should bring only inputs it owns and explain material changes since the previous cycle.
A practical review agenda is:
- Confirm the current inventory position by SKU and complete kit version.
- Review actual usage, stockouts, replacements, and returns against the prior forecast.
- Update hiring, client, event, and promotional demand drivers.
- Review supplier lead time, MOQ, open orders, and quality holds.
- Compare low, expected, and high scenarios for material uncertainty.
- Decide purchase, production, allocation, or substitution actions.
- Record owners, deadlines, and the next review trigger.
Keep the forecast versioned. Record the forecast date, data cutoff, assumptions, changes, and approvals. This makes it possible to explain why a purchase was placed and whether the issue was forecast error, supply failure, program change, or data quality.
Corporate drinkware inventory forecasting checklist
| Control question | Evidence to retain |
|---|---|
| Are demand categories separated? | Replacement, hiring, client, event, and promotion tabs |
| Are product and kit versions defined? | SKU master and approved pack-out |
| Are stockouts and unavailable periods marked? | Reason codes and inventory history |
| Are one-time events separated from repeat seasonality? | Event calendar and repeatability decision |
| Are hiring and client inputs owned? | Approved forecast from HR, sales, or marketing |
| Are low, expected, and high scenarios visible? | Scenario table and decision note |
| Are MOQ and supplier capacity included? | Supplier quote and capacity confirmation |
| Is inventory measured as usable complete kits? | Physical, allocated, quarantine, and component status |
| Are forecast outcomes measured? | Bias, error, stockouts, excess, and event service level |
| Is the next review date assigned? | Forecast version, owner, and change log |
Corporate drinkware inventory forecasting works best when the forecast reflects how the program actually operates. Separate routine demand from events, treat hiring and client plans as explicit drivers, distinguish sales from unmet demand, and connect every major input to an owner. Then convert the forecast into time-phased purchasing, supplier capacity checks, reorder points, safety stock, and allocation rules.
The goal is not perfect prediction. The goal is a transparent plan that reduces avoidable stockouts, emergency shipping, excess branded inventory, and obsolete packaging while protecting the dates and recipient experiences that matter most. When procurement, HR, marketing, sales, logistics, quality, and suppliers work from the same definitions, the forecast becomes a practical operating control rather than a number that sits unused in a spreadsheet.
References